Introduction to gridded class
5 minute read
An introduction to the Gridded class. Loading variables and grid information.
This is designed to be a brief introduction to the Gridded class including: 1. Creation of a Gridded object 2. Loading data into the Gridded object. 3. Combining Gridded output and Gridded domain data. 4. Interrogating the Gridded object. 5. Basic manipulation ans subsetting 6. Looking at the data with matplotlib
Loading and Interrogating
Begin by importing COAsT and define some file paths for NEMO output data and a NEMO domain, as an example of model data suitable for the Gridded object.
import coast
import matplotlib.pyplot as plt
import datetime
import numpy as np

# Define some file paths
root = "./"
dn_files = root + "./example_files/"

fn_nemo_dat = dn_files + "coast_example_nemo_data.nc"
fn_nemo_dom = dn_files + "coast_example_nemo_domain.nc"
fn_config_t_grid = root + "./config/example_nemo_grid_t.json"
/usr/share/miniconda/envs/coast/lib/python3.10/site-packages/pydap/lib.py:5: DeprecationWarning: pkg_resources is deprecated as an API. See https://setuptools.pypa.io/en/latest/pkg_resources.html
/usr/share/miniconda/envs/coast/lib/python3.10/site-packages/pkg_resources/__init__.py:2871: DeprecationWarning: Deprecated call to `pkg_resources.declare_namespace('pydap')`.
Implementing implicit namespace packages (as specified in PEP 420) is preferred to `pkg_resources.declare_namespace`. See https://setuptools.pypa.io/en/latest/references/keywords.html#keyword-namespace-packages
/usr/share/miniconda/envs/coast/lib/python3.10/site-packages/pkg_resources/__init__.py:2871: DeprecationWarning: Deprecated call to `pkg_resources.declare_namespace('pydap.responses')`.
Implementing implicit namespace packages (as specified in PEP 420) is preferred to `pkg_resources.declare_namespace`. See https://setuptools.pypa.io/en/latest/references/keywords.html#keyword-namespace-packages
/usr/share/miniconda/envs/coast/lib/python3.10/site-packages/pkg_resources/__init__.py:2350: DeprecationWarning: Deprecated call to `pkg_resources.declare_namespace('pydap')`.
Implementing implicit namespace packages (as specified in PEP 420) is preferred to `pkg_resources.declare_namespace`. See https://setuptools.pypa.io/en/latest/references/keywords.html#keyword-namespace-packages
/usr/share/miniconda/envs/coast/lib/python3.10/site-packages/pkg_resources/__init__.py:2871: DeprecationWarning: Deprecated call to `pkg_resources.declare_namespace('pydap.handlers')`.
Implementing implicit namespace packages (as specified in PEP 420) is preferred to `pkg_resources.declare_namespace`. See https://setuptools.pypa.io/en/latest/references/keywords.html#keyword-namespace-packages
/usr/share/miniconda/envs/coast/lib/python3.10/site-packages/pkg_resources/__init__.py:2350: DeprecationWarning: Deprecated call to `pkg_resources.declare_namespace('pydap')`.
Implementing implicit namespace packages (as specified in PEP 420) is preferred to `pkg_resources.declare_namespace`. See https://setuptools.pypa.io/en/latest/references/keywords.html#keyword-namespace-packages
/usr/share/miniconda/envs/coast/lib/python3.10/site-packages/pkg_resources/__init__.py:2871: DeprecationWarning: Deprecated call to `pkg_resources.declare_namespace('pydap.tests')`.
Implementing implicit namespace packages (as specified in PEP 420) is preferred to `pkg_resources.declare_namespace`. See https://setuptools.pypa.io/en/latest/references/keywords.html#keyword-namespace-packages
/usr/share/miniconda/envs/coast/lib/python3.10/site-packages/pkg_resources/__init__.py:2350: DeprecationWarning: Deprecated call to `pkg_resources.declare_namespace('pydap')`.
Implementing implicit namespace packages (as specified in PEP 420) is preferred to `pkg_resources.declare_namespace`. See https://setuptools.pypa.io/en/latest/references/keywords.html#keyword-namespace-packages
/usr/share/miniconda/envs/coast/lib/python3.10/site-packages/pkg_resources/__init__.py:2871: DeprecationWarning: Deprecated call to `pkg_resources.declare_namespace('sphinxcontrib')`.
Implementing implicit namespace packages (as specified in PEP 420) is preferred to `pkg_resources.declare_namespace`. See https://setuptools.pypa.io/en/latest/references/keywords.html#keyword-namespace-packages
We can create a new Gridded object by simple calling coast.Gridded(). By passing this a NEMO data file and a NEMO domain file, COAsT will combine the two into a single xarray dataset within the Gridded object. Each individual Gridded object should be for a specified NEMO grid type, which is specified in a configuration file which is also passed as an argument. The Dask library is switched on by default, chunking can be specified in the configuration file.
nemo_t = coast.Gridded(fn_data = fn_nemo_dat, fn_domain = fn_nemo_dom, config=fn_config_t_grid)
/usr/share/miniconda/envs/coast/lib/python3.10/site-packages/xarray/core/dataset.py:282: UserWarning: The specified chunks separate the stored chunks along dimension "time_counter" starting at index 2. This could degrade performance. Instead, consider rechunking after loading.
Our new Gridded object nemo_t contains a variable called dataset, which holds information on the two files we passed. Let’s have a look at this:
#nemo_t.dataset # uncomment to print data object summary
This is an xarray dataset, which has all the information on netCDF style structures. You can see dimensions, coordinates and data variables. At the moment, none of the actual data is loaded to memory and will remain that way until it needs to be accessed.
Along with temperature (which has been renamed from votemper) a number of other things have happen under the hood:
- The dimensions have been renamed to
t_dim,x_dim,y_dim,z_dim - The coordinates have been renamed to
time,longitude,latitudeanddepth_0. These are the coordinates for this grid (the t-grid). Alsodepth_0has been calculated as the 3D depth array at time zero. - The variables
e1,e2ande3_0have been created. These are the metrics for the t-grid in the x-dim, y-dim and z_dim (at time zero) directions.
So we see that the Gridded class has standardised some variable names and created an object based on this discretisation grid by combining the appropriate grid information with all the variables on that grid.
We can interact with this as an xarray Dataset object. So to extract a specific variable (say temperature):
ssh = nemo_t.dataset.ssh
#ssh # uncomment to print data object summary
Or as a numpy array:
ssh_np = ssh.values
#ssh_np.shape # uncomment to print data object summary
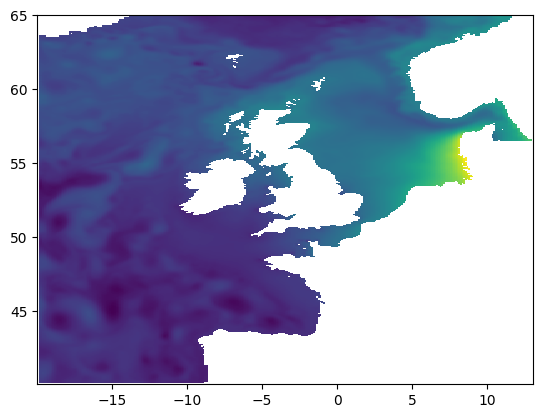
Then lets plot up a single time snapshot of ssh using matplotlib:
plt.pcolormesh(nemo_t.dataset.longitude, nemo_t.dataset.latitude, nemo_t.dataset.ssh[0])
<matplotlib.collections.QuadMesh at 0x7fb31d487fa0>

Some Manipulation
There are currently some basic subsetting routines for Gridded objects, to cut out specified regions of data. Fundamentally, this can be done using xarray’s isel or sel routines to index the data. In this case, the Gridded object will pass arguments straight through to xarray.isel.
Lets get the indices of all model points within 111km km of (5W, 55N):
ind_y, ind_x = nemo_t.subset_indices_by_distance(centre_lon=-5, centre_lat=55, radius=111)
#ind_x.shape # uncomment to print data object summary
Now create a new, smaller subsetted Gridded object by passing those indices to isel.
nemo_t_subset = nemo_t.isel(x_dim=ind_x, y_dim=ind_y)
#nemo_t_subset.dataset # uncomment to print data object summary
Alternatively, xarray.isel can be applied directly to the xarray.Dataset object.
A longitude/latitude box of data can also be extracted using Gridded.subset_indices().
Plotting example for NEMO-ERSEM biogechemical variables
Import COAsT, define some file paths for NEMO-ERSEM output data and a NEMO domain, and read/load your NEMO-ERSEM data into a gridded object, example:
import coast
import matplotlib.pyplot as plt

# Define some file paths
root = "./"
dn_files = root + "./example_files/"

fn_bgc_dat = dn_files + "coast_example_SEAsia_BGC_1990.nc"
fn_bgc_dom = dn_files + "coast_example_domain_SEAsia.nc"
fn_config_bgc_grid = root + "./config/example_nemo_bgc.json"

nemo_bgc = coast.Gridded(fn_data = fn_bgc_dat, fn_domain = fn_bgc_dom, config=fn_config_bgc_grid)
#nemo_bgc.dataset # uncomment to print data object summary
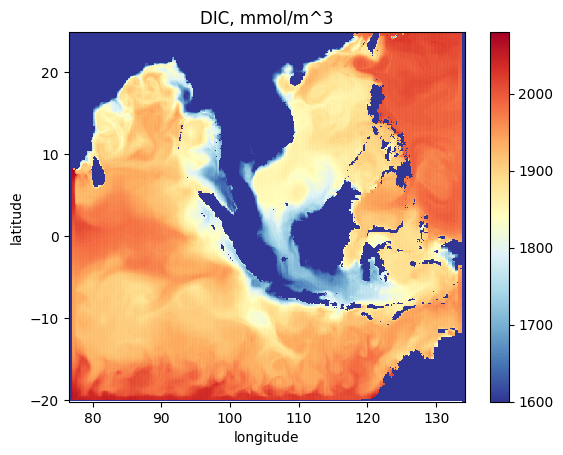
As an example plot a snapshot of dissolved inorganic carbon at the sea surface
fig = plt.figure()
plt.pcolormesh(
    nemo_bgc.dataset.longitude,
    nemo_bgc.dataset.latitude,
    nemo_bgc.dataset.dic.isel(t_dim=0).isel(z_dim=0),
    cmap="RdYlBu_r",
    vmin=1600,
    vmax=2080,
)
plt.colorbar()
plt.title("DIC, mmol/m^3")
plt.xlabel("longitude")
plt.ylabel("latitude")
plt.show()
/tmp/ipykernel_2627/2498690501.py:2: UserWarning: The input coordinates to pcolormesh are interpreted as cell centers, but are not monotonically increasing or decreasing. This may lead to incorrectly calculated cell edges, in which case, please supply explicit cell edges to pcolormesh.

Feedback
Was this page helpful?
Glad to hear it!
Sorry to hear that. Please tell us how we can improve.