Mask maker tutorial
8 minute read
A demonstration of the MaskMaker class to build and use regional masking
MaskMasker is a class of methods to assist with making regional masks within COAsT. Presently the mask generated are external to MaskMaker. Masks are constructed as gridded boolean numpy array for each region, which are stacked over a dim_mask dimension. The mask arrays are generated on a supplied horizontal grid. The masks are then stored in xarray objects along with regions names.
Examples are given working with Gridded and Profile data.
Relevant imports and filepath configuration
import coast
import numpy as np
from os import path
import matplotlib.pyplot as plt
import matplotlib.colors as colors  # colormap fiddling
import xarray as xr
/usr/share/miniconda/envs/coast/lib/python3.10/site-packages/pydap/lib.py:5: DeprecationWarning: pkg_resources is deprecated as an API. See https://setuptools.pypa.io/en/latest/pkg_resources.html
/usr/share/miniconda/envs/coast/lib/python3.10/site-packages/pkg_resources/__init__.py:2871: DeprecationWarning: Deprecated call to `pkg_resources.declare_namespace('pydap')`.
Implementing implicit namespace packages (as specified in PEP 420) is preferred to `pkg_resources.declare_namespace`. See https://setuptools.pypa.io/en/latest/references/keywords.html#keyword-namespace-packages
/usr/share/miniconda/envs/coast/lib/python3.10/site-packages/pkg_resources/__init__.py:2871: DeprecationWarning: Deprecated call to `pkg_resources.declare_namespace('pydap.responses')`.
Implementing implicit namespace packages (as specified in PEP 420) is preferred to `pkg_resources.declare_namespace`. See https://setuptools.pypa.io/en/latest/references/keywords.html#keyword-namespace-packages
/usr/share/miniconda/envs/coast/lib/python3.10/site-packages/pkg_resources/__init__.py:2350: DeprecationWarning: Deprecated call to `pkg_resources.declare_namespace('pydap')`.
Implementing implicit namespace packages (as specified in PEP 420) is preferred to `pkg_resources.declare_namespace`. See https://setuptools.pypa.io/en/latest/references/keywords.html#keyword-namespace-packages
/usr/share/miniconda/envs/coast/lib/python3.10/site-packages/pkg_resources/__init__.py:2871: DeprecationWarning: Deprecated call to `pkg_resources.declare_namespace('pydap.handlers')`.
Implementing implicit namespace packages (as specified in PEP 420) is preferred to `pkg_resources.declare_namespace`. See https://setuptools.pypa.io/en/latest/references/keywords.html#keyword-namespace-packages
/usr/share/miniconda/envs/coast/lib/python3.10/site-packages/pkg_resources/__init__.py:2350: DeprecationWarning: Deprecated call to `pkg_resources.declare_namespace('pydap')`.
Implementing implicit namespace packages (as specified in PEP 420) is preferred to `pkg_resources.declare_namespace`. See https://setuptools.pypa.io/en/latest/references/keywords.html#keyword-namespace-packages
/usr/share/miniconda/envs/coast/lib/python3.10/site-packages/pkg_resources/__init__.py:2871: DeprecationWarning: Deprecated call to `pkg_resources.declare_namespace('pydap.tests')`.
Implementing implicit namespace packages (as specified in PEP 420) is preferred to `pkg_resources.declare_namespace`. See https://setuptools.pypa.io/en/latest/references/keywords.html#keyword-namespace-packages
/usr/share/miniconda/envs/coast/lib/python3.10/site-packages/pkg_resources/__init__.py:2350: DeprecationWarning: Deprecated call to `pkg_resources.declare_namespace('pydap')`.
Implementing implicit namespace packages (as specified in PEP 420) is preferred to `pkg_resources.declare_namespace`. See https://setuptools.pypa.io/en/latest/references/keywords.html#keyword-namespace-packages
/usr/share/miniconda/envs/coast/lib/python3.10/site-packages/pkg_resources/__init__.py:2871: DeprecationWarning: Deprecated call to `pkg_resources.declare_namespace('sphinxcontrib')`.
Implementing implicit namespace packages (as specified in PEP 420) is preferred to `pkg_resources.declare_namespace`. See https://setuptools.pypa.io/en/latest/references/keywords.html#keyword-namespace-packages
# set some paths
root = "./"
dn_files = root + "./example_files/"
fn_nemo_grid_t_dat = dn_files + "nemo_data_T_grid_Aug2015.nc"
fn_nemo_dom = dn_files + "coast_example_nemo_domain.nc"
config_t = root + "./config/example_nemo_grid_t.json"
Loading data
# Create a Gridded object and load in the data:
nemo = coast.Gridded(fn_nemo_grid_t_dat, fn_nemo_dom, config=config_t)
Initialise MaskMaker and define target grid
mm = coast.MaskMaker()

# Define Regional Masks
regional_masks = []

# Define convenient aliases based on nemo data
lon = nemo.dataset.longitude.values
lat = nemo.dataset.latitude.values
bathy = nemo.dataset.bathymetry.values
Use MaskMaker to define new regions
MaskMaker can build a stack of boolean masks in an xarray dataset for regional analysis. Regions can be supplied by providing vertices coordiates to the make_region_from_vertices method. (Vertices coordinates can be passed as xarray objects or as numpy arrays).
The method returns a numpy array of booleans.
# Draw and fill a square
vertices_lon = [-5, -5, 5, 5]
vertices_lat = [40, 60, 60, 40]

# input lat/lon as xr.DataArray
filled1 = mm.make_region_from_vertices(nemo.dataset.longitude, nemo.dataset.latitude, vertices_lon, vertices_lat)
# input lat/lon as np.ndarray
filled2 = mm.make_region_from_vertices(
    nemo.dataset.longitude.values, nemo.dataset.latitude.values, vertices_lon, vertices_lat
)

check = (filled1 == filled2).all()
print(f"numpy array outputs are the same? {check}")
numpy array outputs are the same? True
The boolean numpy array can then be converted to an xarray object using make_mask_dataset() for improved interactions with other xarray objects.
mask_xr = mm.make_mask_dataset(nemo.dataset.longitude.values, nemo.dataset.latitude.values, filled1)
Use MaskMaker for predefined regions
The NWS has a number of predefined regions. These are numpy boolean arrays as functions of the specified latitude, longitude and bathymetry. They can be appended into a list of arrays, which can be similarly converted into an xarray object.
masks_list = []

# Add regional mask for whole domain
masks_list.append(np.ones(lon.shape))

# Add regional mask for English Channel
masks_list.append(mm.region_def_nws_north_north_sea(lon, lat, bathy))
masks_list.append(mm.region_def_nws_south_north_sea(lon, lat, bathy))
masks_list.append(mm.region_def_nws_outer_shelf(lon, lat, bathy))
masks_list.append(mm.region_def_nws_norwegian_trench(lon, lat, bathy))
masks_list.append(mm.region_def_nws_english_channel(lon, lat, bathy))
masks_list.append(mm.region_def_nws_off_shelf(lon, lat, bathy))
masks_list.append(mm.region_def_nws_irish_sea(lon, lat, bathy))
masks_list.append(mm.region_def_nws_kattegat(lon, lat, bathy))
masks_list.append(mm.region_def_nws_fsc(lon, lat, bathy))

masks_names = ["whole domain", "northern north sea", "southern north sea", "outer shelf",
               "norwegian trench", "english_channel",  "off shelf",
                "irish sea", "kattegat", "fsc"]
As before the numpy arrays (here as a list) can be converted into an xarray dataset where each mask is separated along the dim_mask dimension
mask_xr = mm.make_mask_dataset(lon, lat, masks_list, masks_names)
Inspect mask xarray object structure
mask_xr
Plot masks
Inspect the mask with a quick_plot() method.
mm.quick_plot(mask_xr)
/usr/share/miniconda/envs/coast/lib/python3.10/site-packages/xarray/core/utils.py:494: FutureWarning: The return type of `Dataset.dims` will be changed to return a set of dimension names in future, in order to be more consistent with `DataArray.dims`. To access a mapping from dimension names to lengths, please use `Dataset.sizes`.
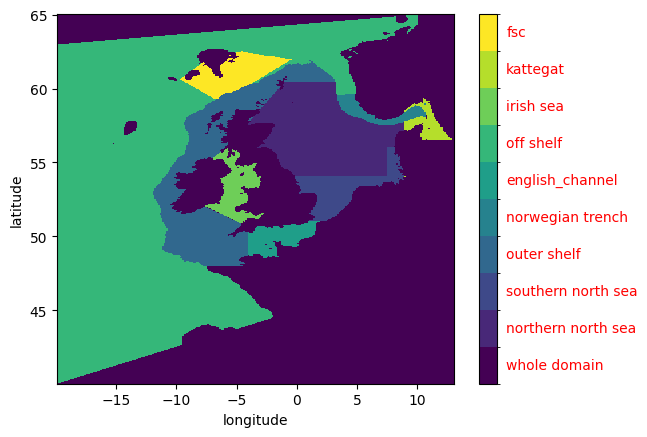
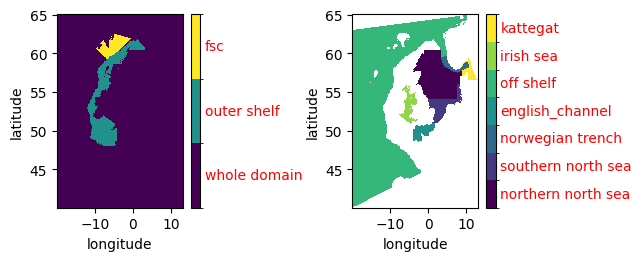
NB overlapping regions are not given special treatment, the layers are blindly superimposed on each other. E.g. as demonstrated with “Norwegian Trench” and “off shelf”, “FSC” and “off shelf”, or “whole domain” and any other region.
plt.subplot(2,2,1)
mm.quick_plot(mask_xr.sel(dim_mask=[0,3,9]))

plt.subplot(2,2,2)
mm.quick_plot(mask_xr.sel(dim_mask=[1,2,4,5,6,7,8]))

plt.tight_layout()
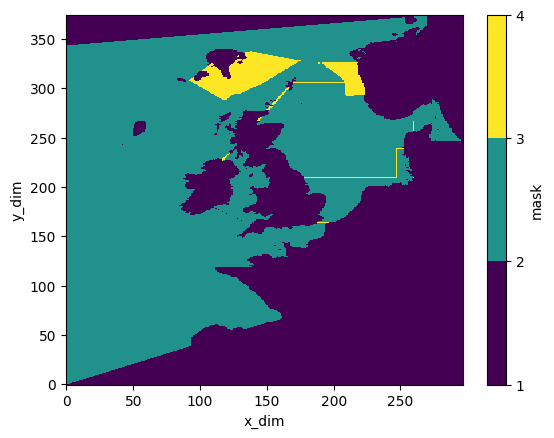
# Show overlap
mask_xr.mask.sum(dim='dim_mask').plot(levels=(1,2,3,4))

# Save if required
#plt.savefig('tmp.png')
<matplotlib.collections.QuadMesh at 0x7ff422dad570>
Regional analysis with Profile data
Apply the regional masks to average SST
# Read EN4 data into profile object
fn_prof = path.join(dn_files, "coast_example_en4_201008.nc")
fn_cfg_prof = path.join("config","example_en4_profiles.json")
profile = coast.Profile(config=fn_cfg_prof)
profile.read_en4( fn_prof )
config/example_en4_profiles.json
Then we use ProfileAnalysis.determine_mask_indices() to figure out which profiles in a Profile object lie within each regional mask:
analysis = coast.ProfileAnalysis()
mask_indices = analysis.determine_mask_indices(profile, mask_xr)
This returns an object called mask_indices, which is required to pass to ProfileAnalysis.mask_means(). This routine will return a new xarray dataset containing averaged data for each region:
profile_mask_means = analysis.mask_means(profile, mask_indices)
/usr/share/miniconda/envs/coast/lib/python3.10/site-packages/xarray/core/utils.py:494: FutureWarning: The return type of `Dataset.dims` will be changed to return a set of dimension names in future, in order to be more consistent with `DataArray.dims`. To access a mapping from dimension names to lengths, please use `Dataset.sizes`.
This routine operates over all variables in the profile object. It calculates means by region preserving depth information (profile_mean_*) and also averaging over depth information (all_mean_*). The variables are returned with these prefixes accordingly.
profile_mask_means
<xarray.Dataset>
Dimensions:                             (dim_mask: 8, z_dim: 400)
Coordinates:
region_names                        (dim_mask) <U18 'whole domain' … 'k…
Dimensions without coordinates: dim_mask, z_dim
Data variables:
profile_mean_depth                  (dim_mask, z_dim) float32 3.802 … nan
profile_mean_potential_temperature  (dim_mask, z_dim) float32 4.629 … nan
profile_mean_temperature            (dim_mask, z_dim) float32 4.629 … nan
profile_mean_practical_salinity     (dim_mask, z_dim) float32 29.08 … nan
profile_mean_qc_flags_profiles      (dim_mask) float64 4.422e+05 … 1.93…
profile_mean_qc_flags_levels        (dim_mask, z_dim) float64 1.693e+07 ….
all_mean_depth                      (dim_mask) float32 219.3 48.17 … 86.48
all_mean_potential_temperature      (dim_mask) float32 7.458 6.68 … 7.266
all_mean_temperature                (dim_mask) float32 7.48 6.685 … 7.275
all_mean_practical_salinity         (dim_mask) float32 34.57 34.86 … 33.76
all_mean_qc_flags_profiles          (dim_mask) float64 4.422e+05 … 1.93…
all_mean_qc_flags_levels            (dim_mask) float64 3.272e+07 … 3.68…
Notice that the number of mask dimensions is not necessarily preserved between the mask and the mask averaged variables. This happens if, for example, there are no profiles in one of the mask regions
check1 = mask_indices.dims["dim_mask"] == profile_mask_means.dims["dim_mask"]
print(check1)
False


/usr/share/miniconda/envs/coast/lib/python3.10/site-packages/xarray/core/utils.py:494: FutureWarning: The return type of `Dataset.dims` will be changed to return a set of dimension names in future, in order to be more consistent with `DataArray.dims`. To access a mapping from dimension names to lengths, please use `Dataset.sizes`.
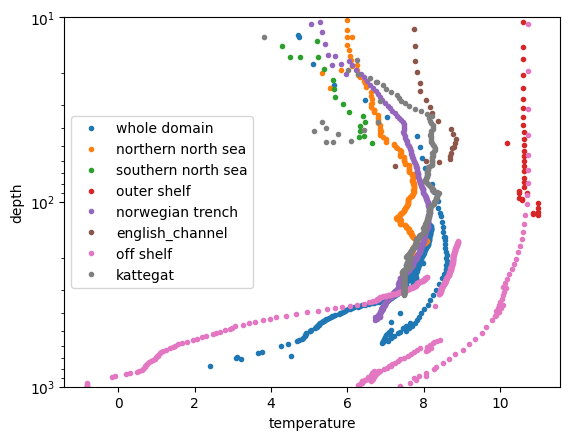
The mean profiles can be visualised or further processed (notice the Irish Sea region and FSC are missing because there were no profiles in the example dataset)
for count_region in range(profile_mask_means.sizes['dim_mask']):
    plt.plot(
            profile_mask_means.profile_mean_temperature.isel(dim_mask=count_region),
            profile_mask_means.profile_mean_depth.isel(dim_mask=count_region),
            label=profile_mask_means.region_names[count_region].values,
            marker=".", linestyle='none')

plt.ylim([10,1000])
plt.yscale("log")
plt.gca().invert_yaxis()
plt.xlabel('temperature'); plt.ylabel('depth')
plt.legend()
<matplotlib.legend.Legend at 0x7ff41ca08c40>
Regional analysis with Gridded data
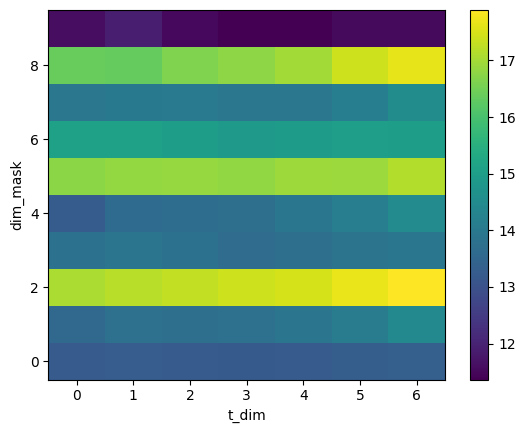
Apply the regional masks to average SST. This is done manually as there are not yet COAsT methods to broadcast the operations across all variables.
# Syntax: xr.where(if <first>, then <2nd>, else <3rd>)
mask_SST = xr.where( mask_xr.mask, nemo.dataset.temperature.isel(z_dim=0), np.NaN)

# Take the mean over space for each region
mask_mean_SST = mask_SST.mean(dim="x_dim").mean(dim="y_dim")
# Inspect the processed data
mask_mean_SST.plot()
<matplotlib.collections.QuadMesh at 0x7ff422cef100>
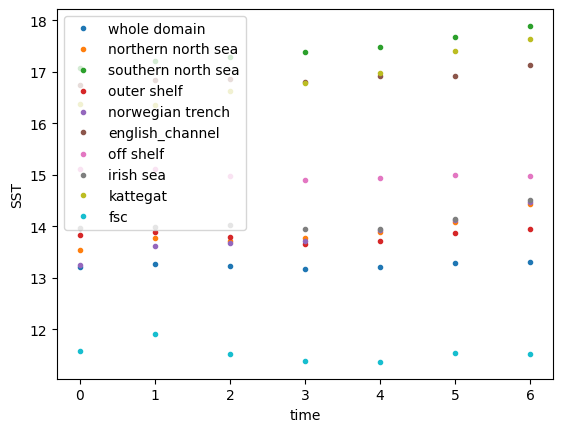
# Plot timeseries per region

for count_region in range(mask_mean_SST.sizes['dim_mask']):

    plt.plot(
        mask_mean_SST.isel(dim_mask=count_region),
        label=mask_mean_SST.region_names[count_region].values,
        marker=".", linestyle='none')

plt.xlabel('time'); plt.ylabel('SST')
plt.legend()
<matplotlib.legend.Legend at 0x7ff422cbac80>
Feedback
Was this page helpful?
Glad to hear it!
Sorry to hear that. Please tell us how we can improve.